
First Steps
- Working with Report Data: What you'll learn
In this lesson, you will learn:
- how to set date ranges and comparison date ranges
- how to graph data and access report views
- how to quickly filter and sort data in reports
- when to use annotations
- how to identify metrics and dimensions
- how to segment data using Advanced Segments
In this lesson, you will learn:
- how to set date ranges and comparison date ranges
- how to graph data and access report views
- how to quickly filter and sort data in reports
- when to use annotations
- how to identify metrics and dimensions
- how to segment data using Advanced Segments

.png)
.png)
Select date ranges by clicking on the day and month within the calendar or you can type dates in the “Date Range” boxes.
Once you set a date range, it stays active until you change it, or log out.
.png)
The date range and comparison date ranges you select will apply to all your reports and graphs.
.png)
Most reports include an over-time graph at the top. You can make this graph display data by day, week, or month.
.png)
You can attach short notes or annotations to specific dates. Annotations are especially useful when you’re looking at historical data and wondering whether certain campaigns or outside events had some effect on your traffic.
To add an annotation, just click the date on the graph and select “Create new annotation”.
You can allow anyone with access to the profile to see the annotation, or make it private so that only you see it.
.png)
A metric is a measurement. Examples of metrics are “number of visits”, “pages viewed per visit”, and “average time on site”.
Metrics appear in scorecards and as columns in tables.
Metrics can also be graphed.
.png)
You can graph any metric in a scorecard, simply by clicking it. Here, we’ve graphed Average Time on Site.
.png)
You can compare two metrics on the same graph to see how they are correlated.
Click Compare Metric and select from the drop down.
In this example, we’re adding Average Time on Site to the graph.
.png)
Groups of metrics are organized into tabs.
The Site Usage tab shows metrics such as the number of pages viewed per visit, the average time on site, and the bounce rate.
Goal Set tabs shows the conversion rates for each of your goals.
If you’ve enabled ecommerce, you’ll also see an Ecommerce tab.
.png)
The AdWords reports have an additional tab called Clicks. This tab contains AdWords related metrics such as clicks, cost, revenue per click and ROI.
The AdSense tab contains AdSense metrics such as revenue from AdSense and AdSense ads clicked.
.png)
Many reports contain tables. These tables usually break out your data by a single dimension.
Each row in the table shows the data for a different value of the dimension.
In this example, the dimension being shown is City. Each row contains the data for a different city.
.png)
Each row in this table corresponds to a kind of browser – Internet Explorer, Firefox, Chrome and so on.
Each row in this table corresponds to a kind of browser – Internet Explorer, Firefox, Chrome and so on.
So, this table is showing data for different values of the dimension “Browser”.
Each row in this table corresponds to a kind of browser – Internet Explorer, Firefox, Chrome and so on.
So, this table is showing data for different values of the dimension “Browser”.
.png) The Viewing option above the table lets us change the dimension. If we click Operating System as the Viewing Option, the table shows data for each kind of operating system.
The Viewing option above the table lets us change the dimension. If we click Operating System as the Viewing Option, the table shows data for each kind of operating system.
.png)
We can also add a secondary dimension. This lets us see data for each combination of two dimensions.
In this example, the table shows data for each operating system.
Let’s look at what happens if we select Browser as a secondary dimension.
.png) Now we can see data for each Operating System and Browser combination.
Now we can see data for each Operating System and Browser combination.
So, we can see data for Windows and Firefox, Windows and Chrome, Macintosh and Safari, Macintosh and Chrome, and so on.
.png)
To filter the data that appears in a table, click the Search option above the table.
In this example, we’re excluding visits from London and New York and also excluding any visits in which there were fewer than 2 pages viewed.
.png)
The View option lets you visualize data in different ways.
The Data view organizes your report data into a table. This is the default view for many reports.
.png) The Percentage view creates a pie-chart based on any one of the metrics in the report.
The Percentage view creates a pie-chart based on any one of the metrics in the report.
The Performance view shows a bar-graph based on any metric you select.
.png)
The Comparison view allows you to quickly see whether each entry in the table is performing above or below average.
Term Cloud helps you visualize your keywords.
.png)
Pivot creates a pivot table in which both rows and columns can break out dimension values.
In this example, we can see how many visits were referred by each combination of keyword and search engine.
Keywords are shown as rows and search engines are shown as columns.
You can select the metrics you want to display in the table and the dimensions.
.png)
Columns within tables can be sorted in both ascending and descending order simply by clicking on the column heading.
The arrows next to the heading title indicate the order in which the results are listed.
A down arrow indicates descending order and an upward arrow indicates ascending order.
.png)
By default, all reports with tables display ten rows.
To display more than ten rows, go to the bottom of your report and click the dropdown menu arrow next to “Show rows”.
You can display up to 500 rows per page.
.png)
An advanced segment is a subset of your data.
For example, by selecting Visits with Transactions, you can limit your analysis to just the visits during which a person bought something.
If you apply a single advanced segment, all your reports are limited to the data in that segment until you select a different segment.
You can always go back to seeing all your data by selecting the All Traffic segment.
.png)
You can select up to four segments at a time. This allows you to compare data for each segment side by side as you go through your reports.
In this case, we’ve selected three segments: Visits with Transactions, Search Traffic, and Paid Search Traffic.
.png)
Default Segments are predefined and available to anyone using Google Analytics.
Custom Segments are segments that you define. We’ll learn how to create custom segments in later lesson.
.png)
Interpreting Reports
Interpreting Reports
- Time Metrics: What you'll learnIn this lesson, you will learn:
- how Time on Page and Time on Site are calculated
- how Avg. Time on Page and Avg. Time on Site are calculated
- Traffic Sources: What you'll learnIn this lesson, you will learn:
- about the different kinds of traffic sources
- how to identify quality traffic
- how to identify revenue and conversion drivers
- what kinds of information to look for in keyword reports
- how campaign attribution works in Google Analytics
- Content Reports: What you'll learnIn this lesson, you will learn:
- how to use the Pages and Content Drilldown reports
- how to use the Landing Pages report
- how to use and interpret the Navigation Summary report
- how to use and interpret the Entrance Paths report
Interpreting Reports
- Time Metrics: What you'll learnIn this lesson, you will learn:
- how Time on Page and Time on Site are calculated
- how Avg. Time on Page and Avg. Time on Site are calculated


.png)
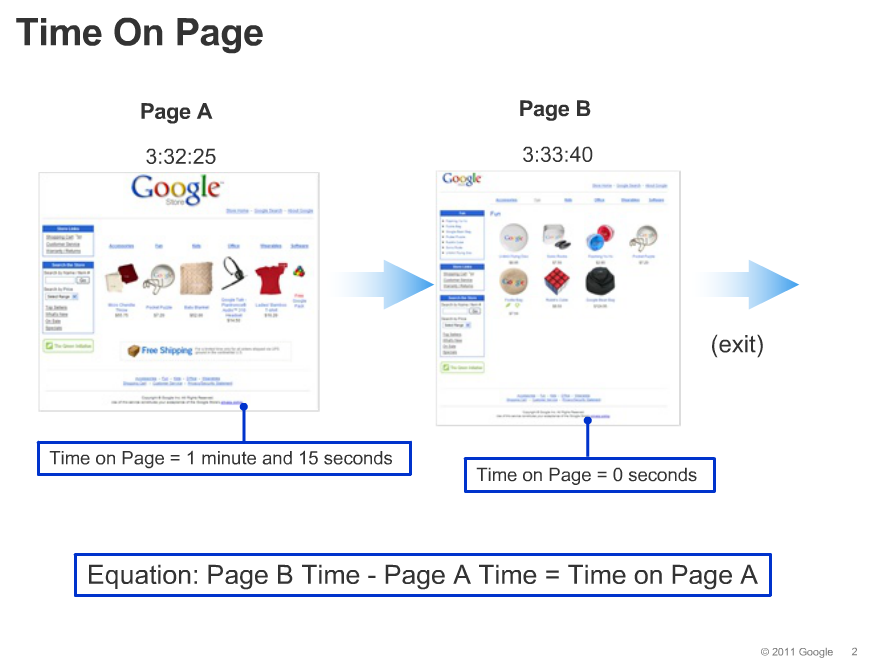
To calculate Time on Page, Google Analytics compares the timestamps of the visited pages.
For example, in the slide, the visitor saw page A, then page B, and then left the site.
The Time on Page for page A is calculated by subtracting the page A timestamp from the page B timestamp.
So, the Time on Page for page A is 1 minute and 15 seconds.
In order for this calculation to take place, the Google Analytics Tracking Code must be executed on both pages.
The Time on Page for page B is 0 seconds, because there is no subsequent timestamp that Google Analytics can use to calculate the actual Time on Page.
.png)
The second page now has a Time on Page of 1 minute 10 seconds.
The Time on Site is now calculated as 2 minutes and 25 seconds.
For Average Time on Page, bounces are excluded from the calculation. In other words, any Time on Page of 0 is excluded from the calculation.
.png)
For Average Time on Site, bounces remain a part of the calculation.
To calculate Average Time on Site, Google Analytics divides the total time for all visits by the number of visits.
.png)
Some sites make extensive use of Flash or other interactive technologies.
Often, these kinds of sites don’t load new pages frequently and all the user interaction takes place on a single page.
As a result, it’s common for sites like this to have high bounce rates and low average times on site.
If you have such a site, you may wish to set up your tracking so that virtual pageviews or events are generated as the user performs various activities.
You can learn how to do this in the module on Event Tracking and Virtual Pageviews.
.png)
Visit Duration categorizes visits according to the amount of time spent on the site during the visit.
The graph allows you to visualize the entire distribution of visits instead of simply the ‘Average Time on Site’ across all visits.
You can see whether a few visits are skewing your ‘Average Time on Site’ upward or downward.
Visit Duration can be found in the Engagement report under Behavior in the Visitors section.
.png)
- Traffic Sources: What you'll learnIn this lesson, you will learn:
- about the different kinds of traffic sources
- how to identify quality traffic
- how to identify revenue and conversion drivers
- what kinds of information to look for in keyword reports
- how campaign attribution works in Google Analytics

.png)
.png)
The reports in the Traffic Sources section show you where your traffic is coming from on the internet.
You can compare your traffic sources against each other to find out which sources send you the highest quality traffic.
.png)
Direct Traffic represents visitors who clicked on a bookmark to arrive at your site, or who typed the URL directly into their browser.
Referring Sites include any sites that send traffic to you. These could be banner ads or links featured on blogs, affiliates, or any site that links to your site.
Search Engine traffic represents visitors who click on a search results link in Google, Yahoo, or any other search engine.
Search Engine traffic can be organic -- in other words, free search results -- or paid.
Paid search engine traffic is pay per click or cost per click traffic that you purchase from a search engine -- for example on Google AdWords.
Understanding which search engines send you qualified traffic can help you select the search engines on which you want to advertise.
.png)
Looking at the highest traffic drivers is a start, but it doesn’t tell you whether the traffic was qualified.
In other words, did the traffic help you achieve the goals you’ve set for your site?
One easy indicator of quality is Bounce Rate -- the percentage of visits in which the person left without viewing any other pages.
In the slide, although blogger.com sent the most traffic, it has an 88% bounce rate. A bounce rate this high suggests that the site isn’t relevant to what the visitor is looking for
By clicking the “compare to site average” icon and selecting a comparison metric, you can see which sources outperform and underperform the site average.
So here, for example, if we select Bounce Rate as our comparison metric. we can see that the two most popular sources of traffic underperform the site average.
One note about bounce rate, if your site is a blog, bounce rate may not be relevant. With blogs, it’s common for people to look at a single page and then leave.
.png)
The All Traffic report lists all of the sources sending traffic to your site -- including referrals, search engine traffic, and direct traffic
This report is particularly helpful because you can identify your top performing sources, regardless of whether they are search engines or sites.
For example, in the report, we see that blogger.com referred more traffic than any other source. It has a medium of referral because it is a referral from a site.
The second most popular source of traffic was direct. Direct traffic always has a medium of (none).
Free Google search engine traffic was the fourth largest referrer.
The medium of organic tells us that this traffic came from clicks on unpaid search engine results.
The medium of cpc on this entry -- for cost per click -- tells us that this traffic came from paid search results.
You may sometimes see _referrals_ from google.com. These can come from Google Groups posts or static pages on other Google sites.
.png)
If you have goals or ecommerce set up on your site, you have a much wider range of metrics with which to assess performance.
Click on the Goal Set or Ecommerce tabs to view which sources are driving conversions and purchases.
In this case, we’re looking at metrics on the Ecommerce tab and comparing each traffic source’s revenue with the site average.
.png)
To see the keywords that people used to find your site, go the Search Overview under Incoming Sources in the Traffic Sources section.
Then, in the Search Overview report, click Keyword as the viewing option.
.png)
Looking at keywords is a very useful for understanding what visitors were expecting to find on your site.
Keywords with a high bounce rate tell you where you failed to meet that expectation.
For example, in the slide example, the ‘google games’ phrase has a 84% bounce rate. Let’s find out what landing page is being used.
We start by clicking on the ‘google games’ entry in the table.
.png)
This takes us to the Keyword report for ‘google games’.
To find out which landing page is being used for this keyword, we’ll click Other as the Viewing Option above the table, and select Landing Page.
.png)
We can now see which landing page is being used and evaluate it’s relevance to the keyword.
This report can be particularly helpful if multiple landing pages are being used.
You can find out which landing pages are responsible for the poor performance and send the keyword traffic to the most effective landing page.
Be sure to also check the bounce rates for organic, non-paid keywords. This information can offer insights into how to best focus your search engine optimization efforts.
.png)
By default, Google Analytics attributes a conversion or sale to the campaign that most recently preceded the conversion or sale.
For example, if a visitor clicks on an AdWords ad (Campaign 1 in the first session) and then later returns via a referral to purchase something (Referrer 1 in the second session), the referral will get credit for the sale.
However, if instead the visitor returns directly, then the AdWords ad (Campaign 1) will still get credit for the sale.
To prevent a specific referral or campaign from overriding a prior campaign, simply append “utm_nooverride=1” to all referring campaign links as shown in the slide. This ensures that the conversion is always attributed to the original referrer (or first campaign the user clicked on).
Therefore, in the example above, the original campaign will continue to get credit for the conversion.
If a visitor returns via a link without the utm_nooverride, as in the third example, that campaign will get credit for the sale since it overwrites all previous referring campaigns.
.png)
- Content Reports: What you'll learnIn this lesson, you will learn:
- how to use the Pages and Content Drilldown reports
- how to use the Landing Pages report
- how to use and interpret the Navigation Summary report
- how to use and interpret the Entrance Paths report

.png)
.png)
Two reports in the Content section focus on page traffic, but each report organizes it differently.
The Pages report lists each page that received traffic.
The Page Title viewing option on the Pages report groups your pages according to Title tag. You can click on a title to see the pages that share that title.
The Content Drilldown report groups pages according to directory. You can click on a directory to see the pages in the directory.
.png)
The Landing Pages report lists all of the pages through which people entered your site.
You can use this report to monitor the number of bounces and the bounce rate for each landing page.
Bounce rate is good indicator of landing page relevance and effectiveness.
You can lower bounce rates by tailoring each landing page to its associated ads and referral links.
The more relevant the page, the less likely a visitor will be to bounce.
.png)
The Navigation Summary can help you understand how people move through your site.
It shows how people arrived at a specific page and where they went afterwards.
The report is available from the Pages report.
.png)
Here’s the Navigation Summary report.
Percent Entrances shows how frequently the page was a landing page.
Percent Previous Pages shows how frequently visitors came to the page after viewing another page on the site.
Percent Exits shows how frequently visits ended on this page.
Percent Next Pages shows how frequently visitors continued on to another page on the site.
The list of pages that were viewed immediately before the page or pages is shown in the left column, under Previous Page Path.
The list of pages that were viewed immediately after the page or pages is shown in the right column, under Destination Page.
.png)
The Entrance Paths report is a powerful tool for analyzing navigation paths.
For example, let’s say that you want to find out whether people clicked the Purchase button on your landing page and actually completed the purchase.
To find out, go to the Landing Pages report and click Entrance Paths.
.png)
Select the landing page you want to analyze.
.png)
In the left column, you’ll see all the possible clicks people made on the page. Choose the link that represents the Purchase page.
.png)
In the right hand column, you’ll now see all the pages visitors went to after the Purchase page. By looking at this list, you’ll be able to see how many visits ended up on the Purchase Completion page.
This report can show you if the landing page is doing the job you designed it for.
.png)
Fundamentals
- Campaign Tracking and AdWords Integration: What you'll learnRead the following in the Google Analytics Help Center:
- Analysis Focus - AdWords: What you'll learnIn this lesson, you will learn:
- how to use the Clicks tab metrics in AdWords reports
- how to track ad performance
- Goals in Google Analytics: What you'll learnIn this lesson, you will learn:
- the purpose of using goals, goal values, and goal funnels
- the different kinds of goals
- when to use each Goal URL Match Type
- how to assign meaningful values to goals
- how goal conversions differ from transactions
- Filters in Google Analytics: What you'll learnIn this lesson, you will learn:
- when to apply filters in Google Analytics
- how filters act on data
- how to create custom filters
- the differences between the different kinds of filters (i.e. exclude, include, etc)
- how to filter Google AdWords traffic
- how to use filters and profiles together to track certain kinds of traffic
- best practices for using filters
- Regex and Google Analytics: What you'll learnIn this lesson, you will learn:
- when to use regular expressions in Google Analytics
- how to use the most common metacharacters: dot, backslash, etc.
- how often your data is updated and how Google stores it
- some examples of common regular expressions in Google Analytics
- E-commerce Tracking: What you'll learnIn this lesson, you will learn:
- where to find ecommerce metrics in reports
- how to enable and track ecommerce
Campaign Tracking and AdWords Integration:
- Campaign Tracking and AdWords Integration: What you'll learn
Read the following in the Google Analytics Help Center:
- Configuring AdWords for Analytics (all articles)
- Configuring Custom Campaigns (all articles)
Read the following in the Google Analytics Help Center:
- Configuring AdWords for Analytics (all articles)
- Configuring Custom Campaigns (all articles)


Goals in Google Analytics:
- Goals in Google Analytics: What you'll learnIn this lesson, you will learn:
- the purpose of using goals, goal values, and goal funnels
- the different kinds of goals
- when to use each Goal URL Match Type
- how to assign meaningful values to goals
- how goal conversions differ from transactions

.png)
.png)
Defining site goals and tracking goal conversions is one of the best ways to assess how well your site meets its business objectives. You should always try to define at least one goal for a website.
So what is a goal? In Google Analytics, a goal represents an activity or a level of interaction with your website that’s important to the success of your business.
Some examples of goals are an account signup, a request for a sales call, or even that the visitor spent a certain amount of time on the website.
.png)
There are four types of goals in Google Analytics.
A URL Destination goal is a page that visitors see once they have completed an activity. For an account sign-up, this might be the “Thank You for signing up” page. For a purchase, this might be the receipt page. A URL Destination goal triggers a conversion when a visitor views the page you've specified.
A Time on Site goal is a time threshold that you define. When a visitor spends more or less time on your site than the threshold you specify, a conversion is triggered.
A Pages per Visit goal allows you to define a pages viewed threshold. When a visitor views more pages --or fewer pages --than the threshold you've set, a conversion is triggered.
An Event goal allows you to attach a conversion to an event that you have defined. We’ll learn about events in a subsequent lesson.
.png)
You can see total conversions and conversion rates for each of your goals in your reports.
.png)
For each URL Destination goal that you define, you can also define a funnel. A funnel is the set of steps, or pages, that you expect visitors to visit on their way to complete the conversion.
A sales checkout process is a good example of a funnel. And the page where the visitor enters credit card information is an example of one of the funnel steps.
So, the goal page signals the end of the activity -- such as a “thank you” or “confirmation” page -- and the funnel steps are the pages that visitors encounter on their way to the goal.
.png)
Defining a funnel is valuable because it allows you to see where visitors enter and exit the conversion process.
For example, if you notice that many of your visitors never go further than the “Enter shipping information” page, you might focus on redesigning that page so that it’s simpler.
Knowing which steps in the process lose would-be customers allows you to eliminate bottlenecks and create a more efficient conversion path.
.png)
To set up a goal, first go the Account Administration page. Click the account and web property for which you want to configure a goal.
.png)
Select the profile to which you want to add the goal.
Then, click the goals tab and click the plus-Goal link in one of the Goal sets.
You can create up to 4 sets of 5 goals each.
.png)
To define a URL Destination Goal, select URL Destination as the goal type. Next, enter the URL of the goal page. You don’t have to enter the entire URL. You can simply enter the request URI - that’s what comes after the domain or hostname.
So, if the complete URL is www.googlestore.com/confirmation.php, you only need to enter /confirmation.php.
Make sure that the URL you enter corresponds to a page that the visitor will only see once they complete the conversion activity. So, pick something like the Thank You page or a confirmation page for your goal.
You can also enter a name for the Goal -- here we’ve entered “Completed Order”. This name will appear in your conversion reports.
Defining a funnel is optional. To define your funnel steps, you add the URLs of the pages leading up to the goal URL. Just as with goals, you don’t have to enter the entire URL of a funnel step -- just the request URI is fine.
Provide a name for each step in the funnel -- here we’ve entered “Select gift card “ for Step 1. The names you enter will appear in your reports.
Next, we’ll talk about the Match Type setting.
.png)
The match type defines how Google Analytics identifies a goal or funnel step. You have three choices for the Match Type option.
“Head Match” is the default. It indicates that the URL of the page visited must match what you enter for the Goal URL, but if there is any additional data at the end of their URL then the goal will still be counted. For example, some websites append a product ID or a visitor ID or some other parameter to the end of the URL. Head Match will ignore these.
Here’s another example, illustrated on this slide: If you want every page in a subdirectory to be counted as a goal, then you could enter the subdirectory as the goal and select Head Match.
“Exact Match” means that the URL of the page visited must exactly match what you enter for the Goal URL. In contrast to Head Match, which can be used to match every page in a subdirectory, Exact Match can only be used to match one single page. Also notice that Exact Match does not match the second pageview, “/offer1/signup.html?query=hats” because of the extra query parameter at the end.
“Regular Expression Match” gives you the most flexibility. For example, if you want to count any sign-up page as a goal, and sign-up pages can occur in various subdirectories, you can create a regular expression that will match any sign-up page in any subdirectory. Regular Expressions will be covered in a later module.
When you use Regular Expression Match, the value you enter as the goal URL as well as each of the funnel steps will be read as a Regular Expression.
Remember that regardless of which option you choose, Google Analytics is only matching Request URIs. In other words, the domain name is ignored.
.png)
Check “Case Sensitive” if you want the URLs you entered into your goal and funnel to exactly match the capitalization of visited URLs.
.png)
To define a Time on Site goal, select Time on Site as the goal type. Next, select "Greater than" or "Less than" and enter an amount of time, for example 15 minutes. We'll discuss goal value shortly.
To define a Pages per Visit goal, select Pages per Visit as the goal type. Next, select "Greater than", "Equal to", or "Less than" and enter a number of pages.
Threshold goals are useful for measuring site engagement, whereas URL Destination goals are best for measuring how frequently a specific activity has been completed. If your objective is for visitors to view as much content as possible, you might set a Pages per Visit goal. Or, if you have a customer support site and your objective is for visitors to get the information they need in as short a time as possible, you might set a Time on Site goal with a "Less than" condition.
.png)
The “Goal Value” field allows you to specify a monetary value for goal. You should only do this for non-ecommerce goals.
By setting a goal value, you make it possible for Google Analytics to calculate metrics like average per-visit-value and ROI. These metrics will help you measure the monetary value of a non-ecommerce site.
Just think about how much each goal conversion is worth to your business. So, for example, if your sales team can close sales on 10% of the people who request to be contacted via your site, and your average transaction is $500, you might assign $50 or 10% of $500 to your "Contact Me" goal.
Again, to avoid inflating revenue results, you should only provide values for non-ecommerce goals.
.png)
There is an important difference between goal conversions and e-commerce transactions.
A goal conversion can only happen once during a visit, but an e-commerce transaction can occur multiple times during a visit.
Let’s say that you set one of your goals to be a PDF download and you define it such that any PDF download is a valid goal conversion. And let’s say that the goal is worth $5.
In this case, if a visitor comes to your site and downloads 5 PDF files during a single session, you’ll only get one conversion worth $5. However, if you were to track each of these downloads as a $5 e-commerce transaction, you would see 5 transactions and $25 in e-commerce revenue.
You’ll learn how to set up ecommerce tracking and how to track PDF downloads in later modules.
.png)
If you are using a filter that manipulates the Request URI, make sure that your URL Destination goal is defined so that it reflects the changed Request URI field. For example, in the slide, we have a profile that defines /thankyou.html as a URL Destination goal. But we have another profile with a filter that appends the hostname to the Request URI. So, for this profile, we need to change the goal definition accordingly.
.png)
If you define a funnel for a goal, Google Analytics populates the Funnel Visualization report, shown here in the slide.
On the left, you can see how visitors enter your funnel. On the right, you can see where they leave the funnel and where they go.
The middle shows you how visitors progress through the funnel -- how many of them continue on to each step.
In this example, we can see that there were 9,283 entrances at the top of the funnel and 187 completed orders, at the bottom of the funnel.
This report is very useful for identifying the pages from which visitors abandon your conversion funnel.
.png)
Here’s another report in the Goals section. It’s the Reverse Goal Path report. You can see this data even if you haven’t defined a funnel. It lists the navigation paths that visitors took to arrive at a goal page and shows you the number of conversions that resulted from each path.
In this example, we can see that 97 of the conversions resulted from the first navigation path that’s shown.
This is a great report for identifying funnels that you hadn’t considered before and it can give you great ideas for designing a more effective site.
.png)
Filters in Google Analytics
- Filters in Google Analytics: What you'll learnIn this lesson, you will learn:
- when to apply filters in Google Analytics
- how filters act on data
- how to create custom filters
- the differences between the different kinds of filters (i.e. exclude, include, etc)
- how to filter Google AdWords traffic
- how to use filters and profiles together to track certain kinds of traffic
- best practices for using filters
.png)

.png)
Google Analytics filters provide you with an extremely flexible way of defining what data is included in your reports and how it appears.
You can use them to customize your reports so that data that you deem useful is highlighted in interesting ways. Filters can also help you clean up your data so that it is easier to read.
There are two types of filters in Google Analytics – predefined filters and custom filters.
.png)
Filters process your raw traffic data based on the filter specifications. The filtered data is then sent to the respective profile.
Once data has been passed through a filter, Google cannot re-process the raw data.
That’s why we always recommend that you maintain one unfiltered profile so that you always have access to all of your data.
.png)
To set up a goal, first go the Account Administration page. Click your desired account.
You can use the Filters tab to create new filters, edit their settings, and apply them to profiles.
.png)
To create a new filter you will need to complete several fields, including the filter name and type.
If you elect to create a custom filter, you will need to complete several additional fields.
.png)
Google Analytics provides three commonly used predefined filters.
The first filter called “Exclude traffic from domains” excludes traffic from the domain that you specify in the Domainfield. If you apply this filter, Google Analytics will apply a reverse lookup with each visitor’s IP address to determine if the visitor is coming in from a domain that should be filtered out. Domains usually represent the ISP of your visitor although larger companies generally have their IP addresses mapped to their domain name.
The second filter, “Exclude traffic from IP addresses”, removes traffic from addresses entered into the IP address field. This filter is generally used to exclude your internal company traffic.
The third filter, “Include traffic subdirectories”, causes your profile to only report traffic to a specified directory on your site. This is typically used on a profile that is created to track one part of a website.
.png)
As a best practice, we recommend that you create a filter to exclude your internal company traffic from your reports.
To do this you can use the predefined filter “Exclude traffic from IP addresses”. You will need to enter your IP address or range of addresses into the ‘IP address” field.
.png)
In addition to the pre-defined filters that Analytics offers, you can also create custom filters.
Custom filters offer you greater control over what data appears in your profiles.
To create a custom filter, select “Custom filter”. Additional fields will appear when you choose this option.
.png)
Each custom filter has three main parts.
The first part of a custom filter is “Filter Types”. There are six filter types available and each one serves a specific purpose. We’ll look at these in a minute.
The second part is the “Filter Field”. There are numerous fields you can use to create your filter. Examples of some commonly used fields are the “Request URI” and “Visitor Country” fields.
The complete list of fields can be found through the link shown here or you can search for “filter fields” in the Analytics Help Center.
The third part of a custom filter is the “Filter Pattern”. This is the text string that is used to attempt to match pageview data. The pattern that you provide is applied to the field and, if it matches any part of the field, it returns a positive result and causes an action to occur. You’ll need to use POSIX Regular Expressions to create the filter pattern. Learn more in the module on Regular Expressions.
.png)
Here’s a chart that describes the filter types.
Exclude and Include filters are the most common types. They allow you to segment your data in many different ways. They’re frequently used to filter out or filter in traffic from a particular state or country.
Lowercase and Uppercase filters do not require a filter pattern, only a filter field. Lowercase and Uppercase filters are very useful for consolidating line items in a report. Let’s say, for example, that you see multiple entries in your reports for a keyword or a URL, and the only difference between the multiple entries is that sometimes the URL or keyword appears with a different combination of uppercase and lowercase letters. You can use the Lowercase and Uppercase filters to consolidate these multiple entries into a single entry.
Search and Replace filters replace one piece of data with another. They are often used to replace long URL strings with a shorter string that is easier to read and identify in your reports.
You can use Advanced filters to remove unnecessary data, replace one field with another, or combine elements from multiple filter fields. For example, a best practice when tracking multiple subdomains in a single profile is to append the subdomain name to the page names. You can do this by creating an advanced filter that appends Hostname to Request URI.
Let's look at an example of a Search and Replace filter.
.png)
Here’s an example of how you might use a Search and Replace filter.
Let’s say that your website uses category IDs as an organizational structure. So, in your Pages report, you’d see a list of Request URIs that indicate the different pages on your site.
The page “/category.asp?catid=5” is actually the Google Store Wearables page. You could make the Pages report more meaningful by replacing “catid=5” with a descriptive word, like “Wearables”.
.png)
Here’s what the Search and Replace filter might look like. This particular filter would overwrite the entire Request URI with “Wearables.”
This is a simplified example to give you an idea of how you can use filters.
.png)
Using Filters and Profiles
.png)
Once you’ve defined a filter, you can apply it to a single profile or across several profiles.
So, for example, in the slide, the graphic shows a single web property with two profiles.
Filter 1 has been applied to both profiles.
Filter 2 has been applied only to Profile 2.
By setting up multiple profiles and applying filters creatively to each of them, you have a great deal of reporting and analysis flexibility.
.png)
You can also use profiles and filters together to create customized data views.
Let’s say that you want to have two different views of your data -- one view includes only traffic to a subdomain and the other view only includes customers from a specific geographic region.
To do this, you’d set up Profile 2 and Profile 3 as shown here in the chart.
Or, for example, you might want to set up a profile that only inlcudes Google AdWords traffic. We’ll look at how to do this in the next slide. Remember, you always want to maintain a profile that contains all of your data. That’s Profile 1 in the chart.
.png)
To set up a profile that includes only Google AdWords traffic, you need to apply the two Custom Include filters shown in the slide.
In filter one, you’ll filter on campaign source for a pattern of google.
In filter two, you’ll filter on campaign medium for a pattern of cpc.
You can apply these two filters in any order.
.png)
Let’s look at how you can use profiles and filters to track subdomains.
If your subdomains are totally separate businesses, and you have no need for reports that include cumulative traffic to both, then you could simply create a unique web property for each subdomain.
Google Analytics creates a unique web property ID for each web property you set up.
The web property ID comprises the letters “U” “A”, followed by the account ID, followed by another number that distinguishes the web property from other web properties in the account.
In the slide example, web property 1 is distinguished by a dash 1. Web property 2 is distinguished by a dash 2.
So, you’d install the “dash 1” version of your tracking code on your Subdomain A pages, and the “dash 2” version of your tracking code on your Subdomain B pages.
But what if you want to analyze the traffic aggregated across both subdomains? In this case, you could set up 3 duplicate profiles under a single web property.
Then, you’d apply an Include filter to two of the profiles.
Profile 1 includes all traffic to both subdomains.
Profile 2 only includes traffic to subdomain A.
Profile 3 only includes traffic to subdomain B.
In this scenario, you’d install identical tracking code on every page of the site regardless of subdomain.
.png)
When setting up profiles and filters for your Analytics account, you should always create one unfiltered profile that can be a back-up in case your filters do not function as planned or you need more data than you originally thought.
Remember, once your raw data has passed through filters, Google cannot go back and reprocess the data. So, maintaining an unfiltered profile provides you with a backup.
.png)
You can apply multiple include and exclude filters to a single profile, but keep in mind that when more than one filter is applied, the filters will be executed in the same order that they are listed in your Profile Settings.
In other words, the output from one filter is then used as the input for the next filter.
The example shown here illustrates that if you want to include only users from California and Texas, you cannot create two separate include filters because they will cancel each other out. The solution is to create one filter that uses a regular expression to indicate that the Visitor Region should be California or Texas.
.png)
Filtering AdWords Data
.png)
If you drive traffic from AdWords to multiple sites, each of which is tracked in a separate Analytics profile, you’ll need to apply a filter to each site’s profile.
Because, when you apply cost data from an AdWords account, data from the entire account is applied to each profile - Google Analytics doesn’t automatically match campaigns to specific profiles.
.png)
To illustrate what would happen if you don’t apply a filter, let’s imagine that you have two sites and you spend $50 to drive traffic to each of them.
Without a filter, the Clicks tab on each profile would include $100 worth of cost data instead of just the $50 you spent for that site.
So, for each profile that should include a subset of your AdWords data, you’ll need to create a custom include filter.
.png)
Create a custom filter and select the Include filter type.
For the filter field, select “Campaign Target URL”. This field only applies to Google AdWords data.
Use a regular expression to create the filter pattern based on the AdWords destination URL that is applicable to this profile.
Once you’ve saved this filter, only AdWords data for this profile will be displayed in the reports.
.png)
Once you’ve defined a filter, you can apply it to a single profile or across several profiles.
So, for example, in the slide, the graphic shows a single web property with two profiles.
Filter 1 has been applied to both profiles.
Filter 2 has been applied only to Profile 2.
By setting up multiple profiles and applying filters creatively to each of them, you have a great deal of reporting and analysis flexibility.
You can also use profiles and filters together to create customized data views.
Let’s say that you want to have two different views of your data -- one view includes only traffic to a subdomain and the other view only includes customers from a specific geographic region.
To do this, you’d set up Profile 2 and Profile 3 as shown here in the chart.
Or, for example, you might want to set up a profile that only inlcudes Google AdWords traffic. We’ll look at how to do this in the next slide. Remember, you always want to maintain a profile that contains all of your data. That’s Profile 1 in the chart.
To set up a profile that includes only Google AdWords traffic, you need to apply the two Custom Include filters shown in the slide.
In filter one, you’ll filter on campaign source for a pattern of google.
In filter two, you’ll filter on campaign medium for a pattern of cpc.
You can apply these two filters in any order.
Let’s look at how you can use profiles and filters to track subdomains.
If your subdomains are totally separate businesses, and you have no need for reports that include cumulative traffic to both, then you could simply create a unique web property for each subdomain.
Google Analytics creates a unique web property ID for each web property you set up.
The web property ID comprises the letters “U” “A”, followed by the account ID, followed by another number that distinguishes the web property from other web properties in the account.
In the slide example, web property 1 is distinguished by a dash 1. Web property 2 is distinguished by a dash 2.
So, you’d install the “dash 1” version of your tracking code on your Subdomain A pages, and the “dash 2” version of your tracking code on your Subdomain B pages.
But what if you want to analyze the traffic aggregated across both subdomains? In this case, you could set up 3 duplicate profiles under a single web property.
Then, you’d apply an Include filter to two of the profiles.
Profile 1 includes all traffic to both subdomains.
Profile 2 only includes traffic to subdomain A.
Profile 3 only includes traffic to subdomain B.
In this scenario, you’d install identical tracking code on every page of the site regardless of subdomain.
When setting up profiles and filters for your Analytics account, you should always create one unfiltered profile that can be a back-up in case your filters do not function as planned or you need more data than you originally thought.
Remember, once your raw data has passed through filters, Google cannot go back and reprocess the data. So, maintaining an unfiltered profile provides you with a backup.
You can apply multiple include and exclude filters to a single profile, but keep in mind that when more than one filter is applied, the filters will be executed in the same order that they are listed in your Profile Settings.
In other words, the output from one filter is then used as the input for the next filter.
The example shown here illustrates that if you want to include only users from California and Texas, you cannot create two separate include filters because they will cancel each other out. The solution is to create one filter that uses a regular expression to indicate that the Visitor Region should be California or Texas.
Filtering AdWords Data
If you drive traffic from AdWords to multiple sites, each of which is tracked in a separate Analytics profile, you’ll need to apply a filter to each site’s profile.
Because, when you apply cost data from an AdWords account, data from the entire account is applied to each profile - Google Analytics doesn’t automatically match campaigns to specific profiles.
To illustrate what would happen if you don’t apply a filter, let’s imagine that you have two sites and you spend $50 to drive traffic to each of them.
Without a filter, the Clicks tab on each profile would include $100 worth of cost data instead of just the $50 you spent for that site.
So, for each profile that should include a subset of your AdWords data, you’ll need to create a custom include filter.
Create a custom filter and select the Include filter type.
For the filter field, select “Campaign Target URL”. This field only applies to Google AdWords data.
Use a regular expression to create the filter pattern based on the AdWords destination URL that is applicable to this profile.
Once you’ve saved this filter, only AdWords data for this profile will be displayed in the reports.
Regex and Google Analytics:
- Regex and Google Analytics: What you'll learnIn this lesson, you will learn:
- when to use regular expressions in Google Analytics
- how to use the most common metacharacters: dot, backslash, etc.
- how often your data is updated and how Google stores it
- some examples of common regular expressions in Google Analytics


.png)
You can use regular expressions to configure flexible goals and powerful filters.
For example, if you want to create a filter that filters out a range of IP addresses, you’ll need to enter a string that describes the range of the IP addresses that you want excluded from your traffic.
Let’s start off by looking at each metacharacter.
Metacharacters are characters that have special meanings in regular expressions.
.png)
The operative word here is “single”, as the regex would NOT match Act 10, Scene 3. The dot only allows one character, and the number ten contains two characters -- a 1 and a 0.
How would you write a regular expression that would match “Act 10, Scene 3”?
You could use two dots.
To make your regex more flexible, and match EITHER “Act 1, Scene 3” or “Act 10, Scene 3”, you could use a quantifier like the + sign.
But we’ll talk about repetition a bit later in this module.
.png)
Enter the backslash immediately before each metacharacter you would like to escape.
“U.S. Holiday” written this way with periods after the U and the S would match a number of unintended strings, including UPS. Holiday, U.Sb Holiday, and U3Sg Holiday.
Remember that the dot is a special character that matches with any single character, so if you want to treat a dot like a regular dot, you have to escape it with the backslash.
You’ll use backslashes a lot, because dots are used so frequently in precisely the strings you are trying to match, like URLs and IP addresses.
For example, if you are creating a filter to exclude an IP address, remember to escape the dots.
.png)
Use square brackets to enclose all of the characters you want as match possibilities. So, in the slide, you’re trying to match the string U.S. Holiday, regardless of whether the U and the S are capitalized.
However, the expression won’t match U.S. Holiday unless periods are used after both the U and the S. The expression also requires that the H is capitalized.
There is a regex you can write to match all of these variations. The question mark used here is another “quantifier”, like the ‘+’ sign mentioned earlier.
Again, we’ll talk about repetition in the next slide.
You can either individually list all the characters you want to match, as we did in the first example, or you can specify a range.
Use a hyphen inside a character set to specify a range. So instead of typing square bracket 0 1 2 3 4 5 6 7 8 9, you can type square bracket 0 dash 9.
And, you can negate a match using a caret after the opening square bracket.
Typing square bracket caret zero dash nine will exclude all numbers from matching.
Note that later in this module, you will see the caret used a different way—as an anchor.
The use of the caret shown here is specific to character sets, and the negating behaviour occurs only when the caret is used after the opening square bracket in a character set.
.png)
Now let’s talk about using quantifiers to indicate repetition.
In earlier examples, we’ve used the plus sign and the question mark.
The question mark requires either zero or one of the preceding character. In the expression “3-1-?” , the preceding character is a 1. So, both 3 and 3-1 would match.
The plus sign requires at least one of the preceding character. So, “3-1-+” wouldn’t match just a 3. It would match 3-1, 3-1-1, and so on.
The asterisk requires zero or more of the preceding character. In the expression, “3-1-*”, the preceding character is a 1. So it would match 3, 3-1-, 3-1-1, and so forth.
You can also SPECIFY repetition using a minimum and maximum number inside curly brackets.
Recall that a dot matches any single character. What would you use to match a wildcard of indeterminate length?
Dot star will match a string of any size. Dot star is an easy way to say “match anything,” and is commonly used in Google Analytics goals and filters.
.png)
It is handy to use the parentheses and the pipe symbol (also known as the OR symbol) together.
Basically, you can just list the strings you want to match, separating each string with a pipe symbol -- and enclosing the whole list in parentheses.
Here, we’ve listed four variations of “US” that we’ll accept as a match for US Holiday.
If it’s not in the list, it won’t get matched. That’s why “US Holiday” won’t get matched if one of the periods is missing.
In our list, we’ve accounted for both periods missing, but not for just one period missing.
Using question marks, the second regex in the slide will match all of the above.
.png)
The dollar sign says, if there are any more characters after the END of this string, then it’s not a match.
So, caret US means start with US. US Holiday matches, but “Next Monday is a US Holiday” does not match.
Holiday$ means end with Holiday. US Holiday still matches, but “US Holiday Schedule” does not match.
Anchors can be useful when specifying an IP address. Take a look at these examples.
.png)
Some character classes are used so commonly that there is a shorthand you can use instead of writing out the ranges within square brackets.
Let’s look at the example of a simplified regex that could match an addres:
Backslash d means match any one digit zero through nine.
Use curly brackets and a minimum and maximum number to specify how many digits to match.
Backslash d followed by 1 comma 5 in curly brackets means that the address must contain at least one digit, and at most five digits.
Backslash s means that the number should be followed by one space, backslash w means match any alphanumeric character and the star means include as many alphanumeric characters as you want.
“345 Embarcadero” matches, but just “Embarcadero” does not, because this regex requires the string to start with a number.
If you want to make the number optional, group the first part of the regex with parentheses--including the space--and follow it with the question mark.
Note that an address like “1600 Amphitheatre Parkway” would not match either, because the regex does not account for the space between Amphitheatre and Parkway.
The slide shows one way you could account for this.
.png)
.png)
Let’s review.
In the example on the slide, we’ve created an expression that will match the strings Google or Yahoo, regardless of whether or not Google and Yahoo are capitalized.
.png)
Here, we’ve created an expression that will match URLs for internet and theatrical movie trailers.
The first part of the expression indicates that the URL can begin with anything.
Then the expression specifies that the URL must end with index.php?dl=video/trailers/ and then either internet or theatrical.
The $ sign ensures that any URLs that are any longer than this won’t get included in the match.
.png)
You’ll find lots of applications for regular expressions in Google Analytics.
Some common examples are:
• filtering out internal traffic by specifying a set of IP addresses
• setting up a goal that needs to match multiple URLs
• tracking equivalent pages in a funnel
• and using the filter box that appears on your reports to find specific entries in a table.
Here, we’ve created an expression that will match URLs for internet and theatrical movie trailers.
The first part of the expression indicates that the URL can begin with anything.
Then the expression specifies that the URL must end with index.php?dl=video/trailers/ and then either internet or theatrical.
The $ sign ensures that any URLs that are any longer than this won’t get included in the match.
You’ll find lots of applications for regular expressions in Google Analytics.
Some common examples are:
• filtering out internal traffic by specifying a set of IP addresses
• setting up a goal that needs to match multiple URLs
• tracking equivalent pages in a funnel
• and using the filter box that appears on your reports to find specific entries in a table.
.png)
Here’s an example of a custom filter that uses a very simple regular expression.
.png)
Here’s a regular expression used to define a goal URL.
.png)
Here’s how you might use regular expressions to group pages or funnel steps on your site.
Using a regular expression allows you to track them as one funnel step rather than tracking each page or action individually.
Learn how goals and funnels work in the module on goals.
.png)
And, here’s an example of using regular expressions within your reports.
We’re using the Search filter to display all the rows in the table that contain Google or Yahoo.
.png)
Google Analytics provides a tool that makes it easier to generate a regular expression that matches a range of IP addresses.
It’s called the Regular Expression Generator and you can find it at the URL shown in the slide.
Or, you can search for Regular Expression Generator in the Google Analytics Help Center.
.png)
But, it’s important that you think through all the implications of each expression that you use when you set up a filter or a goal.
It’s easy to make a mistake and not get the data or the result you’re looking for.
Set up a duplicate profile to test your regex statements. After enough data has been collected, check your results and make sure they’re what you expect.
Remember to always maintain a backup profile that includes all your data.
There are lots of regex resources on the web. To get started, just search for regex.
.png)
E-commerce Tracking:
- E-commerce Tracking: What you'll learnIn this lesson, you will learn:
- where to find ecommerce metrics in reports
- how to enable and track ecommerce
If your site sells products or services online, you can use Google Analytics e-commerce reporting to track sales activity and performance.
The Ecommerce reports show you your site’s transactions, revenue, and many other commerce-related metrics.
Some examples of the kind of information you can get from the e-commerce reports include:
• the products that were purchased from your online store
• a list of transactions, and
• the number of times people visited your site before purchasing
E-commerce metrics are also available on the Ecommerce tab which appears in many reports.
For example, on the Ecommerce tab of the AdWords Campaigns report, you can see how much revenue is associated with your AdWords campaigns.
In order to use e-commerce reporting, you’ll need to do three things.
First, enable e-commerce reporting within your Analytics website profile.
Second, add or make sure that you’ve added the Google Analytics Tracking Code to your receipt page or “Transaction Complete” page.
Finally, you’ll need to add some additional e-commerce tracking code to your receipt page so that you can capture the details of each transaction.
Let’s take a look at each step.
Step 1 is simply to enable the E-commerce selection for the profile.
Click the Account Administration icon. Navigate to the desired account and web property.
Select the desired profile and click the Profile Settings tab.
You’ll then see the screen shown here.
Select “Yes” next to E-commerce Website and save your changes.
For Step 2, add the Google Analytics Tracking Code to your receipt page. In Step 3, you’ll be adding some ecommerce tracking code to the basic tracking code.
Here’s an example of what the ecommerce tracking code on your receipt page might look like. Remember, you’ll be sandwiching this code into the basic Google Analytics Tracking Code.
In the first part of the code, there is a call to the _addTrans() method. The call to _addTrans() tells Google Analytics that a transaction has occurred.
The arguments to _addTrans() provide details about the transaction -- for example an Order ID, the total order amount, and the amount of tax charged.
After the call to _addTrans(), there must be at least one call to the _addItem() method. This call provides Google Analytics with details about the specific item purchased.
Finally, there is a call to the trackTrans() method which sends all the data to Google Analytics.
Let’s look at each method in more detail.
The _addTrans() method establishes a transaction and takes the arguments shown here.
Your code will need to dynamically retrieve the values from your merchant software to populate these fields.
You can type single-quote single-quote to leave an optional field blank, but note that Order ID and Total are required.
As with _addTrans(), you can leave some of the fields blank, but note that Order ID, SKU or Code, Price and Quantity are required arguments.
Use the same Order ID that you used in the call to addTrans().
If you’re not sure how to write this code, contact your merchant software provider.
Finally, after the calls to _addTrans() and _addItem(), you’ll need to call _trackTrans() to send the transaction information to Google Analytics.
Remember that all of the e-commerce code must appear after the Google Analytics Tracking Code calls _trackPageview().
Generally, you’ll be placing ecommerce tracking code on a secure shopping cart page.
The standard Google Analytics Tracking Code automatically detects when an https protocol is being used.
So you won’t need to add any special tracking code for secure pages.
For example, if you send customers from www.mystore.com to cart.mystore.com, you’re sending them to a subdomain.
If either of these scenarios applies to your site, you’ll need to add some code to some of your pages so that you can track activity across domains and subdomains.
The specific methods you’ll use are listed on the slide and you can learn how to use them in the module on tracking domains and subdomains.
In-Depth Analysis
- Advanced Segmentation: What you'll learnIn this lesson, you will learn:
- how Advanced Segments differ from filtered profiles
- how to create and modify an Advanced Segment
- Analytics Intelligence: What you'll learnIn this lesson, you will learn:
- how to interpret alerts
- the difference between automatic and custom alerts
- how to create a custom alert
- Internal Site Search: What you'll learnIn this lesson, you will learn:
- why internal site search is important
- how to find site search information in your reports
- how to set up Site Search
- how Site Search metrics differ from the metrics in other reports
- Event Tracking and Virtual Pageviews: What you'll learnIn this lesson, you will learn:
- when to use virtual pageviews versus event tracking
- how to generate a virtual pageview
- how to track an event using _trackEvent()
- the relationship between Categories, Actions, Labels, and Values
- best practices for setting up Event Tracking
- Multi-Channel Funnels: What you'll learnIn this lesson, you will learn:
- how to identify each role in a conversion path
- how to interpret the Multi Channel Funnel metrics.
Advanced Segmentation
- Advanced Segmentation: What you'll learnIn this lesson, you will learn:
- how Advanced Segments differ from filtered profiles
- how to create and modify an Advanced Segment


.png)
With Advanced Segments, you can quickly isolate and analyze subsets of your traffic.
You can create an advanced segment that only includes visits that meet a specific set of criteria.
So, for example you can create an advanced segment that only includes visits from a certain geographic region or visits during which more than $100 was spent.
.png)
While it's possible to create filtered profiles that segment traffic data, there are some differences between filtered profiles and advanced segments.
Advanced segments can be applied to historical data, but a filtered profile will only filter traffic going forward. When you create an advanced segment, that segment is available across all of your accounts and profiles. But, a filtered profile is only useful for a specific web property. You can compare up to four advanced segments side by side in your reports. In contrast, filtered profiles can only be viewed one at a time. It is much easier to create an advanced segment than it is to create a filtered profile.
If you want to permanently affect the data that a profile shows, you should use a filtered profile. So if you want a profile that only shows CPC data, you should set up a filtered profile to do this.
And if you want to restrict user access to only a subset of data, the best way to do this is to set up a filtered profile and restrict the users' access to only that profile.
.png)
To apply an advanced segment, simply Click Advanced Segments and select the segments you want.
The Default Segments are predefined, so you don’t have to do anything to use them except to select them.
The Default Segments are predefined, so you don’t have to do anything to use them except to select them.

Once you’ve applied one or more advanced segments, you can see the data for the segments throughout all of your reports.
You can also change your date range and see the segments applied to historical data.
The segments remain applied until you deselect them or you logoff.
.png)
Let’s create an advanced segment that only includes visits during which more than $100 was spent.
Begin by clicking the Advanced Segments pulldown.
Next, click Create a new advanced segment.
.png)
Now you’ll see a screen that looks like this.
Using this screen, you can combine one or more logical statements to define a segment.
.png)
To include only visits during more than $100 was spent, first look for the metric Revenue.
It’s usually easiest to type what you are looking for into the search box, but you can also browse the complete list of metrics and dimensions.
Select the condition Greater than and specify 100.
.png)
Click Preview Segment and you can see the percentage of total visits that are included in the segment.
You can add as many conditions to the segment as you like. When you’ve finished, click Save Segment.
.png)
The segment will now appear in the Custom Segments area of the Advanced Segments pulldown.
.png)
Internal Site Search
- Analytics Intelligence: What you'll learnIn this lesson, you will learn:
- how to interpret alerts
- the difference between automatic and custom alerts
- how to create a custom alert
Internal Site Search
- Internal Site Search: What you'll learnIn this lesson, you will learn:
- why internal site search is important
- how to find site search information in your reports
- how to set up Site Search
- how Site Search metrics differ from the metrics in other reports

.png)
.png)
Google Analytics provides internal site search reports that allow you to see how people search once they’ve arrived at your site.
.png)
So why analyze how people search your site?
On both large and small sites, visitors frequently use search boxes as a form of navigation.
By looking at what people search for, you can identify missing or hidden content on your site, improve search results for key phrases, and even get ideas for new keywords to use in marketing campaigns.
.png)
In order to set up Site Search Tracking for your website, you’ll need to configure your Profile settings.
Click the account administration icon at the top right of any screen in Analytics.
Then navigate to the account, web property, and profile for which you want to enable Site Search reports.
.png)
In the Site Search Settings section, select the 'Do Track Site Search' radio button.
In the 'Query Parameter' field, enter the letter, word or words that designate an internal query parameter.
To find out what the query parameter is, perform a search on your site.
Normally when a user searches on your site, their query can be found in the URL.
For example, if you search on Google.com, you will see your search query preceded by 'q='. Therefore, Google's query parameter would be 'q.'
In the example above, the query parameter is 'q,' and the query was 'Google Analytics’
.png)
What is the query parameter in this example?
Look at the URL that’s generated by your search. You should be able to find your query and the query parameter in the URL.
In this case, the search query was “creating a profile” and you can see that the query parameter is “query”.
Your parameter might be different -- it could be the word "term” or “search”,
Or it might be just a letter, like "s" or ”p".
.png)
If you have a particularly large site, some sections of your site may use different query parameters.
You may provide up to five parameters, separating each parameter by a comma.
Next, select whether or not you want Google Analytics to strip out the query parameter from your URL.
Stripping out the query parameter has the same effect as excluding URL Query Parameters under Profile Settings General Information.
So, if you choose to strip the query parameters, you don't have to also exclude them from your main settings.
Note that Google Analytics will only strip out the query parameters you listed, and not any other parameters in the same URL.
.png)
If you use 'Categories‘ on your site - such as the ability to use drop-down menus to narrow a search - you can include categories in your search analytics.
First, select the “Site search categories” checkbox.
Then, enter your 'Category Parameter' in the field provided. Enter only the letters that designate an internal query category such as 'cat, qc,'.
The same principle that you used to identify the query parameter can be used to identify the category parameter.
Or, you can contact your webmaster to identify the query and category parameters for your site.
Decide if you want to strip out the category parameters that you just provided. If you select the checkbox, only the parameters you provided will be stripped out.
As with the query parameter setting, this has the same effect as excluding URL Query Parameters in the General Information section.
So, if you choose to strip the category parameters here, you don't have to exclude them again from your main settings.
Click ’Apply' to finish.
.png)
To find the Site Search reports, click Site Search under Content.
.png)
The Site Search Usage report compares visitors who used site search to those who did not.
Here we can see that 19% of all visits to this site included a search.
Just above the pie-chart, you’ll notice two dropdown menus. if you select Goal Conversion Rate in the left-most dropdown, you can see how visits that included search compare to visits that did not include search with respect to conversions.
And, you can click the ecommerce tab to see how revenue and other ecommerce metrics differ for visits with and without site search.
.png)
The Search Terms report only includes visits during which a search was performed.
From the screenshot on the slide, you can see that there were 76, 331 total unique searches.
The search terms are listed in the table.
You can see how each term compares in terms of number of searches, percentage of search refinements, and other metrics.
Looking at the search terms that people use to search once they are on your site can give you ideas for keywords that might also help drive traffic to your site.
You can look at this traffic by another dimension. For example, if you wanted to see which cities these visitors came from, you could select City from the Dimension dropdown.
.png)
Start Pages lists all of the pages from which visitors searched.
To find Start Pages, click Pages under Site Search. Then, select “Start Page” as the viewing option above the table.
Click on a page in the table to learn more about the searches that occurred from that page. A detail report will appear which lists all of the search terms that were used from that page.
You can use this report to find out what visitors are searching for from your landing pages and you can use the information to improve the page content.
For example, if many visitors search on "shipping options" from your shopping cart page, you may want to display shipping information directly on the page.
.png)
Which pages are most commonly found through search on your site? Destination Pages tells you.
To find Destination Pages, click Pages under Site Search. Then, select “Destination Page” as the viewing option above the table.
The table shows popular destination pages.
Click on a page in the table to see the specific search terms that led to the page.
.png)
You can see which categories your visitors selected when searching your site.
Go to the Search Terms report and click “Site Search Category” as the viewing option.
This information helps you understand how visitors use your search engine, which product areas and categories are most popular, and how successfully visitors find what they are looking for in each category.
.png)
Your Site Search reports will generally show a different number of conversions than what is shown in all of your other reports.
This is because goal conversions in the Site Search reports are based on visits that include at least one search on your website whereas the goal conversions shown in all other reports are based on all visits.
Because Site Search reports only include conversions from visits that included a search, you can see how effectively searches on your site drive conversions.
If you are confused about the difference between “search term” and “keyword”, it’s helpful to remember that Google Analytics reports use “search term” when referring to internal site searches and “keyword” when referring to external searches.
.png)
Event Tracking and Virtual Pageviews
Event Tracking and Virtual Pageviews
- Event Tracking and Virtual Pageviews: What you'll learnIn this lesson, you will learn:
- when to use virtual pageviews versus event tracking
- how to generate a virtual pageview
- how to track an event using _trackEvent()
- the relationship between Categories, Actions, Labels, and Values
- best practices for setting up Event Tracking
Many websites use technologies such as Flash and Ajax to interact with visitors.
For example, some websites embed video players, games, and other interactive experiences on site pages. However, the basic web analytics model of tracking pageviews doesn’t capture these kinds of interactions. This is because when a visitor interacts with a video player, for example, no pageview is generated.
Some other examples of interactions that don’t generate pageviews are Ajax-based activities, file downloads, and clicks on links that take the visitor to another site.
So how do you track these kinds of activities? There are two ways: virtual pageviews and Event Tracking.
Auto-Tagging Links
You can create a virtual pageview to represent practically any kind of activity or interaction you want.
You simply call _trackPageview() and provide any name you want as the argument.
It’s “virtual” because you’re telling Google Analytics to register a pageview even though no new page has actually been loaded.
You’ll see these virtual pageviews alongside ordinary pageviews in the Pages and Content Drilldown reports.
If you look at the Google Analytics Tracking Code, you’ll notice that it calls _trackPageview().
This lets Google Analytics know that the browser has loaded a page.
When you call _trackPageview(), however, you’ll want to provide an argument that specifies a virtual pagename for the event you’re tracking.
Here are some more examples.
In the first example, we’re tracking a download.
In the second example, we’re tracking a Flash event.
In each of these cases, we’re simply calling _trackPageview() to register a virtual pageview.
It’s a good idea to adopt a clear naming convention for your virtual pageviews. You might, for example, group virtual pageviews into categories by giving them a virtual subdirectory.
Also, since virtual pageviews appear along with standard pageviews in reports, you may wish to create a duplicate profile where you filter out the virtual pageviews.
To make this easy, you might organize all of your virtual pageviews into a “virtual” directory.
The other way to track non-pageview interactions is to use Event Tracking.
One advantage of using Event Tracking is that you won’t generate an extra pageview each time an interaction occurs.
Another advantage is that you can easily organize your events into categories, actions, and labels. And you can even provide values for each event you track.
All of your events show up in the Events reports within the Content section.
Just call the _trackEvent() method each time you want to register an event. The slide shows the full specification of _trackEvent() -- which you can also find documented on the Google Code site -- and how you would actually call it, assuming that you are using Asynchronous Tracking.
We’ll discuss the arguments to _trackEvent() in a minute.
Here’s an example of how you’d call _trackEvent() from a Flash video player.
In this example, _trackEvent will get called each time the visitor releases the Play button on the video player.
_trackEvent will register an event with a category name of “Videos”, an Action name of “Play”, and a Label of “Movie Drama”.
Let’s look at each of these arguments.
Let’s look at each of the arguments to _trackEvent.
The strings that you provide for the first 3 arguments, Category, Action, and Label, govern how the events will be organized in your reports.
So, you’ll want to think carefully about how you want to structure your events.
Category is a name that you supply as a means to group objects -- which are usually user interface elements that you want to track.
So, for example, if you have games and videos on your site, you’d probably want to have a “Games” category and “Videos” category.
Click “Event Category” in the Top Events report to see all the user interface elements with which your visitors interacted.
Action is the name you want to give to the type of interaction you’re tracking.
So, for example, for Videos, you’d probably want to track how many times your visitors pressed Play.
Click “Actions” in the Top Events report to see the interactions that occurred.
The Label argument is optional. A Label allows you to provide additional information for for the event you are tracking.
For example, if you are tracking video plays, you might use the Label argument to specify the name of the movie that was played.
Or, for file downloads, you might use it for the name of the file being downloaded.
Click “Labels” in the Top Events report to see the the Labels of of the events that occurred.
Value is the fourth, and optional, argument to _trackEvent().
Unlike the other arguments which are all strings, Value is an integer. You can use it to assign a numeric value to a tracked page object.
You’ll then be able to see a sum total of these values in the Event Value column of your Events reports.
You’ll also be able to see an average of these values in the Avg. Value column of your Events reports.
So, you might, for example, specify a dollar value when a specific playback marker is reached on your video player. To call _trackEvent() without a value, simply omit the argument.
In your reports, you’ll notice that both Total Events and Unique Events are counted.
Total Events is simply the total number of times an event occurs -- really it’s just the number of times _trackEvent was called.
But, for Unique Events, each particular event is only counted once per visit.
So, if during a single visit, a visitor presses Play 5 times on the same movie, Total Events will be incremented by 5.
But Unique Events will only be incremented by 1, because for Unique Events, a particular event is only counted once per visit.
As we mentioned earlier, the arguments you provide when you call _trackEvent will govern how events are organized in your reports.
So, before you add the calls to _trackEvent to your site, consider these best practices.
First, determine in advance all of the kinds of events you’ll want to track.
Try to create a hierarchy of Categories, Actions, and Labels that will grow with your needs. Work with your report users to make sure that the hierarchy makes sense.
And use a clear and consistent naming convention for your Categories, Actions, and Labels.
Using trackEvent() allows you to analyze event based interactions in much greater detail than is possible using virtual pageviews.
For example, instead of just seeing how many times a movie was played on your site, you can analyze how people use your video player, and see how different events correlate with site usage and ecommerce metrics.
Also, by tracking events separately from pageviews, you won’t inflate your pageview count.
.png)
- Multi-Channel Funnels: What you'll learnIn this lesson, you will learn:
- how to identify each role in a conversion path
- how to interpret the Multi Channel Funnel metrics.
No comments:
Post a Comment